
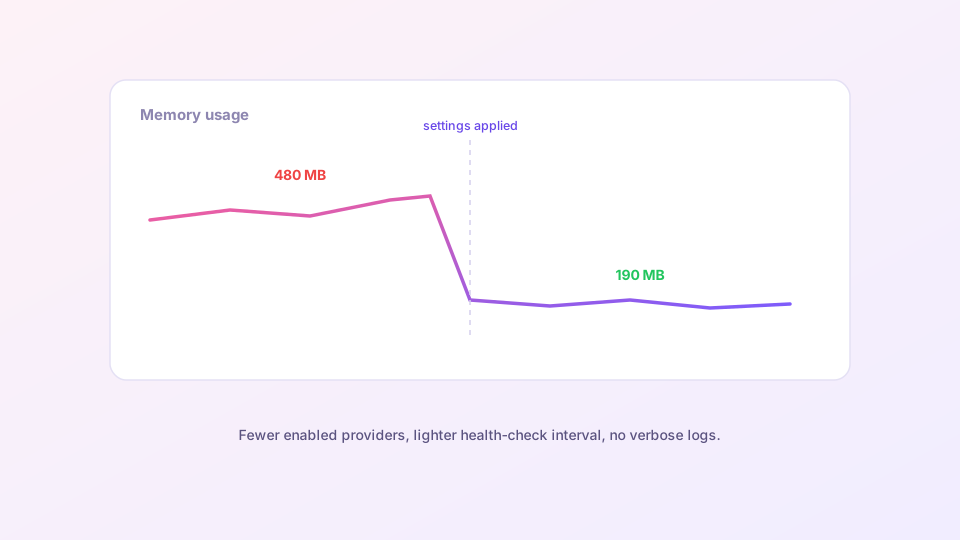
Task Manager shows verge-mihomo at 600 MB? First, calibration: 150–300 MB is normal for a proxy core juggling live connections. Sustained usage above 500 MB is worth acting on. Five fixes, ordered by payoff.
1. Turn the log level down (biggest win)
At debug level the core keeps a huge log buffer in memory. Set Settings → log level back to info; reserve debug for active troubleshooting. If you once opened the Logs page and forgot the level, this single change can free triple-digit megabytes.
2. Tame the connection count
Torrent clients and other P2P software open thousands of concurrent connections, each with state the core must track. Two moves:
- Route downloaders around the core with a process rule:
PROCESS-NAME,qbittorrent.exe,DIRECT; - Watch the Connections page count; if it balloons into the thousands, identify the process responsible before blaming Clash.
3. Slim the subscription
Some subscriptions carry 500+ nodes and dozens of groups — all resident in memory, all multiplied during latency tests. Filter what you never use with a Script:
function main(config) {
  // keep only HK / JP / SG nodes
  config.proxies = config.proxies.filter(
    p => /HK|JP|SG/i.test(p.name)
  );
  return config;
}
4. Relax the health-check interval
url-test groups re-test every 300 seconds by default — a periodic spike proportional to node count. Override the group in Merge: interval: 600 or 900, plus tolerance: 50 so the group does not hop between near-identical nodes (which also prevents mid-game switches).
5. Core-level tuning
profile:
  store-selected: true
tcp-concurrent: true
keep-alive-interval: 15
Add via Merge. Recent Clash Verge versions also expose an experimental memory-reclaim option in Settings — safe to try and observe.
When it is not a memory problem
- Grows forever, resets on restart — update first; several past leaks were fixed in newer releases (update guide);
- UI sluggish, memory normal — an open Connections page rendering thousands of rows is the usual cause; close the page;
- Whole machine slow — check what else is fighting the core; antivirus real-time-scanning the core process is common, whitelist it.
Restart the app after applying changes, then judge by a half-day trend in Task Manager rather than a momentary reading.