
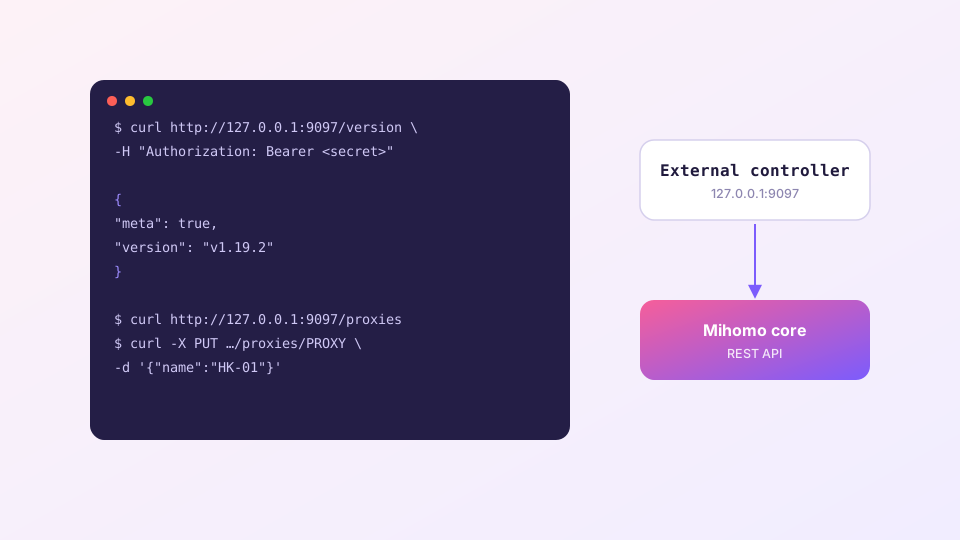
The Clash Verge window is, at heart, a remote control: the Mihomo core underneath exposes an HTTP API, and every click in the UI translates to an API call. You can make those calls yourself — automation scripts, a Stream Deck, or a third-party dashboard all speak the same interface.
Confirm the API is on
Clash Verge enables the external controller by default, usually on 127.0.0.1:9097. The port and secret are visible in Settings under the Clash core section. Verify:
curl http://127.0.0.1:9097/version -H "Authorization: Bearer YOUR_SECRET"A JSON blob with a version number means you are in business.
Keep the secret set. An empty secret combined with listening on 0.0.0.0 hands control of your proxy to the whole LAN — and to any malicious web page that can make your browser fire off requests.
The endpoints that matter
| Endpoint | Method | Purpose |
|---|---|---|
/proxies | GET | All nodes and groups, with current selections |
/proxies/GROUP | PUT | Change the group's selected node |
/configs | PATCH | Runtime config changes — e.g. switch mode |
/connections | GET/DELETE | Inspect or kill live connections |
/proxies/NODE/delay | GET | Latency-test a single node |
Switch nodes in one line
curl -X PUT http://127.0.0.1:9097/proxies/PROXY \
  -H "Authorization: Bearer YOUR_SECRET" \
  -d '{"name":"HK-01"}'
Jump to global mode
curl -X PATCH http://127.0.0.1:9097/configs \
  -H "Authorization: Bearer YOUR_SECRET" \
  -d '{"mode":"global"}'
Web dashboards
yacd and metacubexd are pure API clients that run in a browser tab. Open one, point it at 127.0.0.1:9097 plus your secret, and you have a full management UI — handy for watching connections, or for controlling a PC's core from your phone in combination with Allow LAN.
Automation ideas
- Health-based failover: cron a
/delaycheck every 10 minutes; past a threshold, PUT the group over to a backup; - Meeting mode: one script sets Rule mode and pins the lowest-latency node — bind it to a key;
- Dashboards: poll
/trafficand/connectionsinto Grafana for a live view of the tunnel.
Full API reference: the Mihomo documentation. If what you actually want is making CLI tools route through the proxy (rather than controlling it), that is terminal proxy setup.